Keep your critical infrastructure and data centre running reliably and sustainably. As the UK’s longest-standing Schneider Electric partner, we deliver end-to-end solutions that optimise performance and support your operational goals.
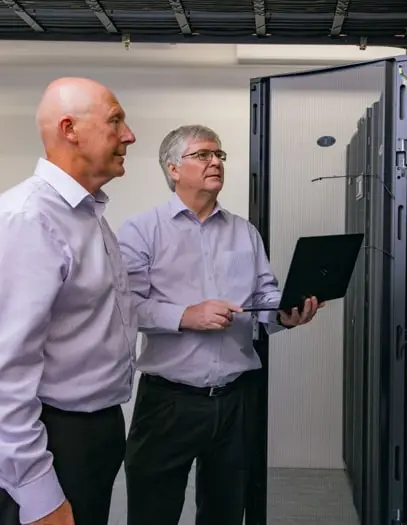
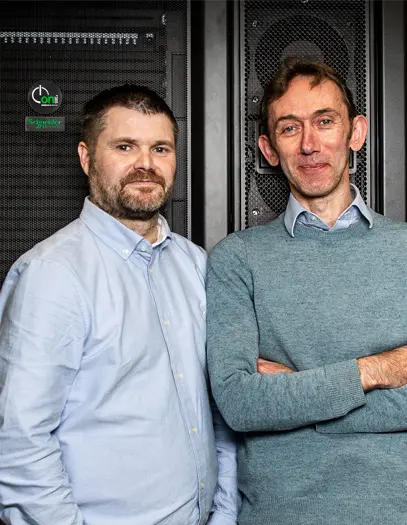
The Schneider Electric Experts
Not just for your data centre but for the entire critical infrastructure lifecycle of your business
As a leading Schneider Electric EcoXpert™ partner for the UK and Ireland, we bring unrivalled expertise and experience, backed by the longest-standing partnership with Schneider Electric. This enables us to provide a truly holistic view of your entire critical infrastructure and to leverage the full suite of Schneider ElectricEcoXpert™ accreditationsfor data centre and critical infrastructure to deliver best-in-class solutions.
Whatever stage your business is at, our Schneider Electric-certified experts deliver the support you need to plan, install and, maintain your critical equipment, helping you achieve your sustainability, efficiency and operational goals.
We specialise in the provision of resilient and sustainable physical infrastructure and data centre solutions across both the public and private sectors.
We partner with Schneider Electric, the industry’s leading supplier with the broadest portfolio of products for power protection, precision cooling & IT equipment racks to protect your business.
We simplify the full data centre and critical infrastructure lifecycle with innovative IoT-enabled services to increase efficiency and reliability with faster deployment or retrofit.
As a trusted and authorised Schneider Electric EcoXpert™ Partner we perform service activities to the same level as our Schneider Electric counterparts, keeping your critical applications operating at optimal performance
Embracing innovation to transform data centre infrastructures
We work closely with Schneider Electric at the very forefront of technology advances for data centre infrastructure to not only meet but exceed the needs of our clients. Discover how we did just that for Markerstudy Group in and Loughborough University in our latest case studies below.
Case Study:
Delivering increased resilience, efficiency, and sustainability for Markerstudy Insurance Group using Schneider Electric EcoStruxure™ Data Center solutions to modernise and integrate its critical physical infrastructure.
Delivering increased reliability and more sustainable operations across the campus using Schneider Electric EcoStruxure™ Data Center solutions to modernise the critical IT infrastructure.